Castillo de San Asenjo
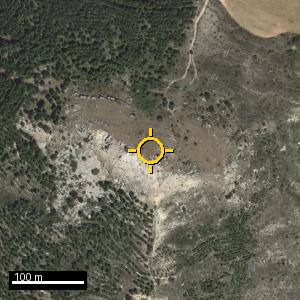
Very good90 / 10041.82676, -3.23931 · 1248 m · totality 20:29:10–20:30:54 local, sun 7.6° up on bearing 283°.
imageryGoogle satBingPNOA photoStreet ViewMapsweatherWindyYrVentuskymeteoblue multimodel- Clearance
- +6.9°sun above the skyline at totality
- Sun visible to
- +0.7°where it is finally lost
- Totality
- 105 sat this exact point
- Access
- Park 52 m away (track)52 m from the nearest track
- Skyline set by
- terraingrassland · 50% tree cover
- August sight line
- 85% usable clear 58% · overcast 15% · CERRA 5.5 km, 135 evenings
- August overhead
- 90% usable clear 67% · overcast 10% · ERA5 25 km
The view west
Your skyline, from 5 m ground survey with the trees on top, and the sun across it from first contact to last.i
The horizontal scale is compass bearing, the vertical is height above the horizon. The red band is totality. The dashed line is how far the sun clears your skyline at that moment, which is the clearance figure in the table above. It is measured from this trace, at the exact pin. A wall or a roof a few tens of metres away counts here, because the survey cannot tell one from a hillside; where that puts the picture at odds with the scored table, both figures are shown and the range of the obstruction is given, so you can see which applies to you.
Getting there
147 min from Salinillas de Buradón · 180.1 km by road · to a road 504 m away, the rest on foot
Cloud on the sight line
15 points west, each read at the light's own height. Worst counts.i
The sun is 8° up, so its light arrives almost sideways and crosses the sky far to the west before it reaches you. Close by it is still near the ground; 50 km out it is at aircraft height. Each point is read at the height the light passes through there. Cloud anywhere on that path hides the sun, whatever the sky above you looks like.
Every cell used, and its forecast at totality
| Layer | Distance | Light is at | Best match | All models | Map | Cell |
|---|---|---|---|---|---|---|
| Near you, low down | 2.0 km | 1,515 m | … | … | Windy | 41.8308, -3.2628 |
| 3.3 km | 1,684 m | … | … | Windy | 41.8334, -3.2776 | |
| 6.5 km | 2,121 m | … | … | Windy | 41.8400, -3.3159 | |
| 9.8 km | 2,560 m | … | … | Windy | 41.8467, -3.3542 | |
| 13.0 km | 3,000 m | … | … | Windy | 41.8533, -3.3924 | |
| Further west, higher up | 13.0 km | 3,000 m | … | … | Windy | 41.8533, -3.3924 |
| 20.3 km | 3,985 m | … | … | Windy | 41.8681, -3.4777 | |
| 27.6 km | 4,978 m | … | … | Windy | 41.8828, -3.5629 | |
| 34.8 km | 5,978 m | … | … | Windy | 41.8976, -3.6481 | |
| 42.1 km | 6,985 m | … | … | Windy | 41.9124, -3.7334 | |
| 49.3 km | 8,000 m | … | … | Windy | 41.9271, -3.8186 | |
| Far west, very high | 49.3 km | 8,000 m | … | … | Windy | 41.9271, -3.8186 |
| 63.3 km | 9,973 m | … | … | Windy | 41.9556, -3.9826 | |
| 77.3 km | 11,973 m | … | … | Windy | 41.9840, -4.1466 | |
| 91.2 km | 14,000 m | … | … | Windy | 42.0124, -4.3106 |
Cloud forecast, every model sight line
Worst reading along the ray,
same axes on every chart.
i
Each layer is
sampled where the ray passes through it and the worst value is charted. A shaded span
means that model has no data there, not clear sky. Low cloud hides a sun this low;
cirrus dims the corona but does not hide it. Fetched by your browser on load.
How it scores
| Component | Points | |
|---|---|---|
| Sun above the skyline | 28.0 / 28 | |
| Sun still up at totality | 13.2 / 20 | |
| Local relief | 16.0 / 16 | |
| Length of totality | 12.3 / 16 | |
| Getting a car to it | 20.0 / 20 | |
| Total | 89.5 / 100 |